
Qtravel has attempted an in-depth analysis of Poles’ tourism behaviour, including in particular the characteristics of purchasing behaviour at the stage of planning and selecting tourist travel. The pilot study was conducted on a group of 280 respondents in the form of an on-line survey and included a series of questions regarding information needs, tourist preferences, as well as elements perceived by potential tourists as particularly frustrating and hindering the process of selecting and purchasing a tourist trip.
This group of 280 people represents a fairly broad cross-section of society in terms of gender, education, place of residence, income level, and tourist preferences. In the following articles we will try to present the results of this research in different sections, which will allow us to observe to what extent demographic characteristics (including age, origin, gender, or level of education) can determine variables such as the number of trips per year, travel destinations, the way in which trips are organized or the perceived ease/difficulty in choosing and purchasing an on-line trip.
However, let us start with a brief presentation of the people who participated in the survey. As shown in Figure 1, significantly more women than men took part in the survey (178 vs 102 respondents).
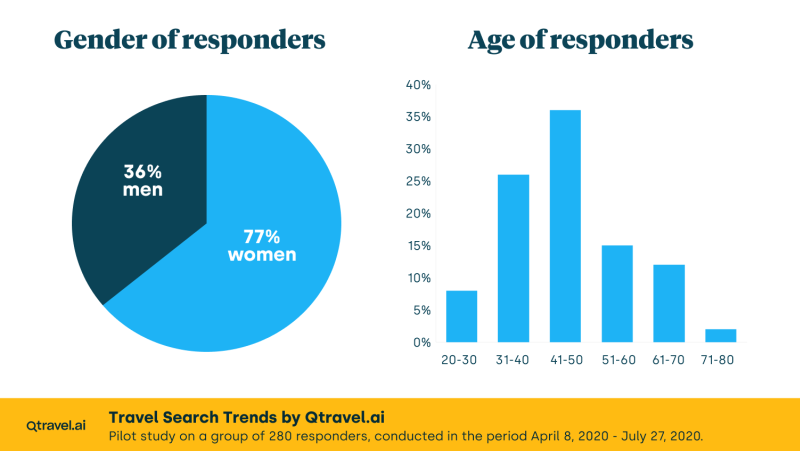
The age distribution of the surveyed population (Figure 1) shows an absolute dominance of the 40-50 year old group (36%), followed by the 30-40 year old group (26%). The average age of respondents was just over 43, and more than half of the respondents (55%) were over this age.
The survey was significantly dominated by people in stable relationships (81%). The share of people declaring themselves as singles or living alone due to random events (death of a spouse) or family events (divorce) did not exceed 20%.
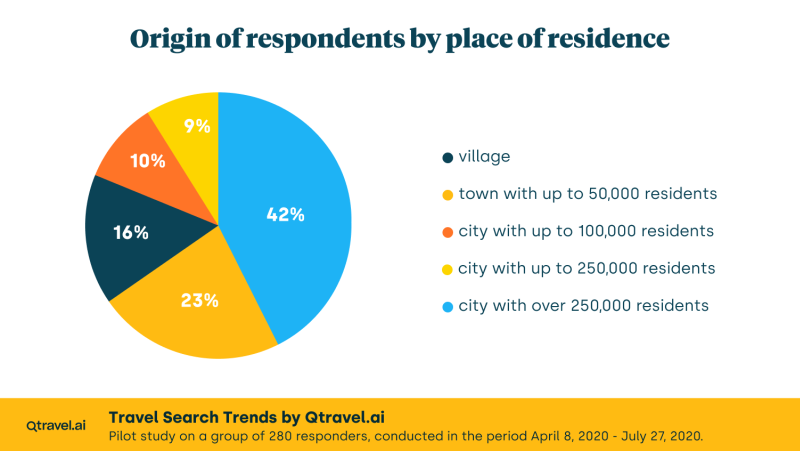
Figure 2 indicates that the survey covered a broad cross-section of the population in terms of place of residence (city/town size). The majority of respondents (43%) come from large and very large cities (over 250,000 inhabitants), which also reflects the wealth structure of Polish society (correlation of income level with the size of the city in which a person works). However, the survey also covered residents of villages (16% of respondents), small towns, and towns with up to 50,000 residents (23% of the surveyed population), small cities with up to 100,000 residents (10% of respondents), and medium-sized cities with 100,000–250,000 residents (9% of respondents).
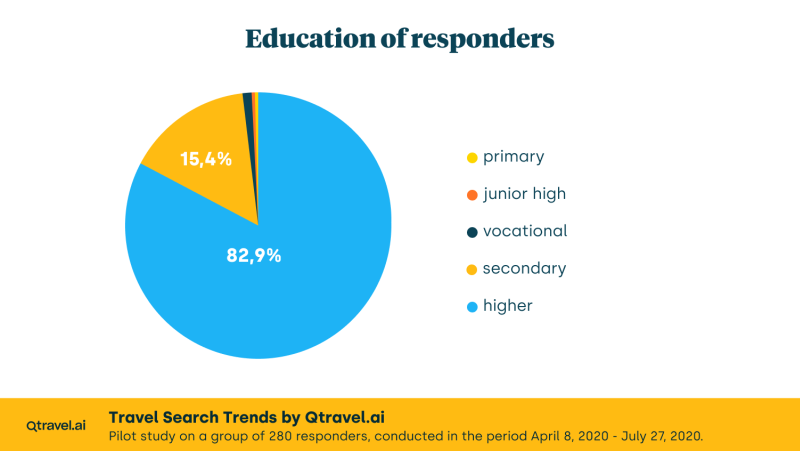
It will also be interesting to link the topic of tourist travel organization with education (Figure 3). The fact that 83% of the survey participants were people who declared higher education, allows us to conclude that educated people are more active in tourism. Only 15% of the respondents declared secondary education.
As far as the structure of employment and professional situation of respondents is concerned (Figure 4), the group of working people (i.e. employed or self-employed) dominated (84%), while the share of pensioners is also significant (13%), i.e. a group of people who, despite having lower income, have much more time, opportunity, and leisure time to choose the date of their tourist trip. The remaining part includes pupils/students (2%), whose leisure time is usually limited by holiday dates. Among those without a permanent job (1%), there are people dependent on their spouses.

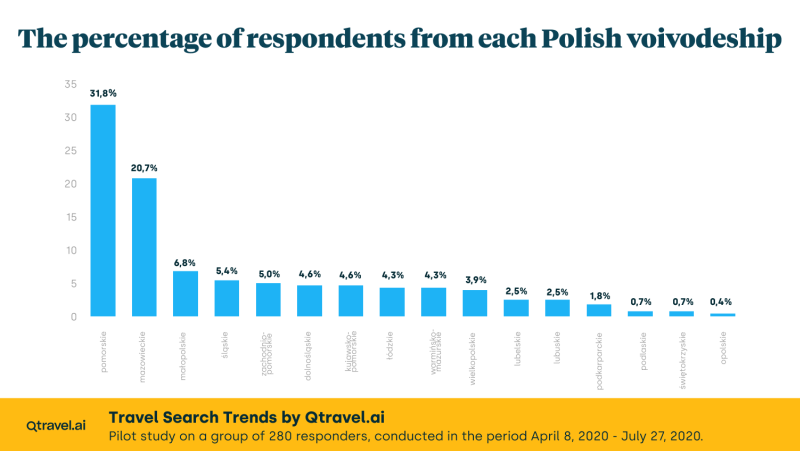
Figure 5 contains information about the number of respondents from particular voivodeships (the study concerned residents of Poland). Respondents from Pomorskie Voivodeship (almost 32%) and Mazowieckie Voivodeship (almost 21%) dominated in terms of numbers, which reflects the significant share of residents of Tricity and Warsaw in the surveyed population that largely consisted of Qtravel customers. Their tourism activity is determined by higher than average earnings, access to education, and greater freedom to undertake tourism trips (convenient transport connections, including flights), i.e. the factors most often indicated in the literature as the variables that affect the freedom to make decisions on travel. The number of inhabitants of MałopolskieVoivodeship did not exceed 7%, and in the case of ŚląskieVoivodeship it amounted to 5.4%. In the remaining cases, it did not exceed 5%.
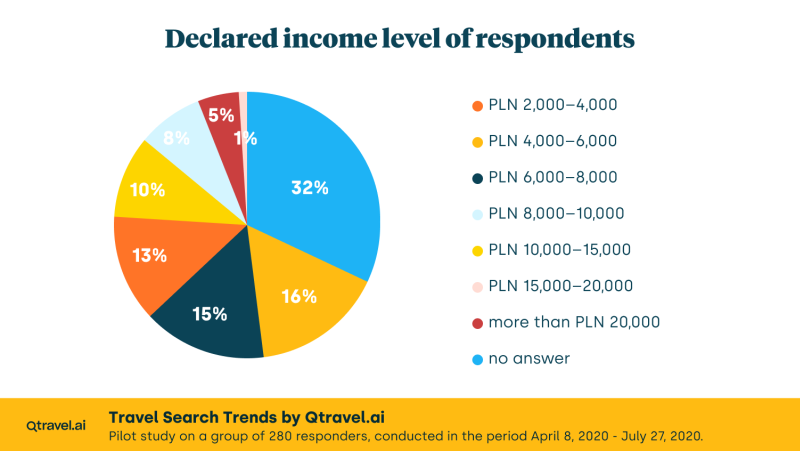
The most important determining factor of participating in tourism is the income in the household (Figure 6), in particular the so-called ‘disposable income’, i.e. amount that remains to be decided upon after all expenses necessary for life and safety of members of a given household are paid. The disposable income may or may not be used for travel. The decision on spending this amount is to a large extent related to the ease/difficulty of accessing information on the tourist offer: the more transparent the information, the better the characterization of transaction conditions (including security of funds, on-line transactions, reliability of available information), the greater the probability that a decision will be made to purchase a tourist trip rather than, e.g., renovate the flat or increase the pool of expenses on durable goods (e.g., a new TV).
A large number of the respondents (28%) refused to provide information about their income level, but the obtained answers allow us to observe a fairly even number of groups that declare expenses within the range of PLN 4,000–6,000 (16%), PLN 6,000–8,000 (15%) and PLN 2,000–4,000(13%). Respondents with the highest income (above PLN 15,000) constitute about 6% of respondents, while the next income brackets, i.e. PLN 8,000–10,000 and PLN 10,000–15,000, constitute 8% and 10% of respondents respectively. A small group of 2% of the respondents declared income that did not exceed PLN 2,000.
This concludes our brief introduction to the participants of the survey. In the following parts we will look at their travel behaviour and decision-making related to travel.
We encourage you to read the rest of the articles in this series:
- Part 1: Profile of the respondents.
- Part 2: How often do tourists travel during the year?
- Part 3: Do we like long holiday stays in Poland?
- Part 4: Poles travelling abroad part 1.
- Part 5: Poles travelling abroad part 2.
- Part 6: How far in advance do we plan tourist trips?
- Part 7: How far in advance do we plan tourist trips? – the income factor.
- Part 8: Flexibility in holiday travel planning.
- Part 9: Frequency of travel versus flexibility in travel planning.
- Part 10: Gender versus flexibility in travel planning.